Action #5497
openCFHTLS training tests with high resolution photo-z added
0%
Description
TRAINING SAMPLE:
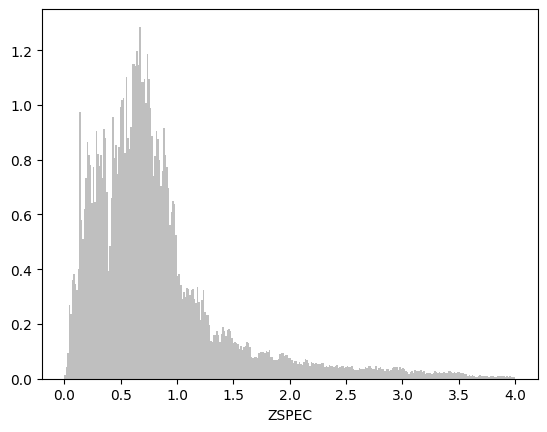
Stephane added high resolution photo-z + lower resolution spec-z to the initial SPEC only catalog that Johanna and Jerome previously used for training.
total = ~250k galaxies with i<25.5 + ~15k galaxies kept aside for testing (randomly picked but with smooth N(z) distribution).
here's the mag/zspec and zspec distributions ("zspec" refers to the redshifts used for training even if there are zphot) :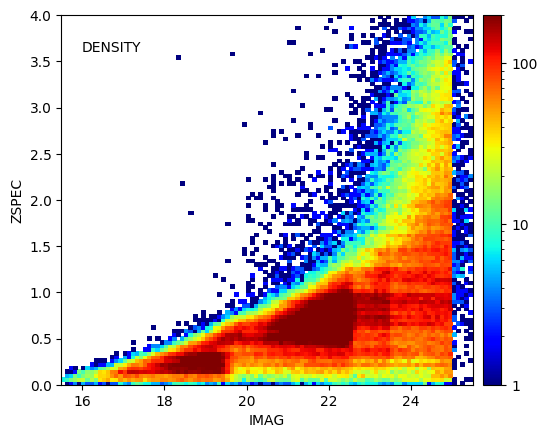
TRAINING TESTS:
model "x" (Jo&Je settings) :
learning rate = 0.0001 to iteration 150000
learning rate = 0.00001 from iteration 150000 to 300000
the model is saved at iteration 300k
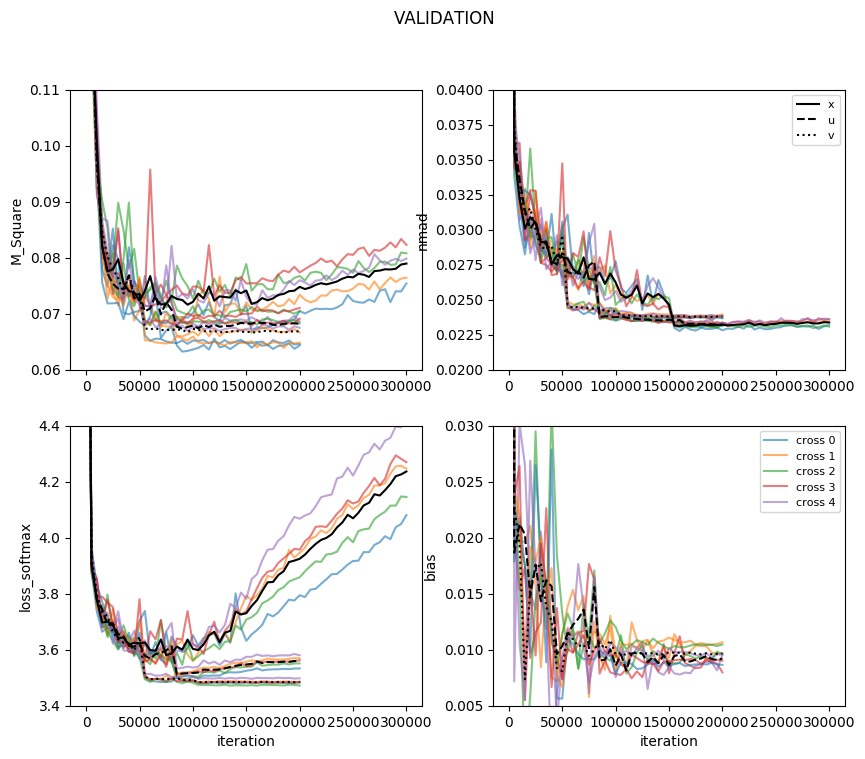
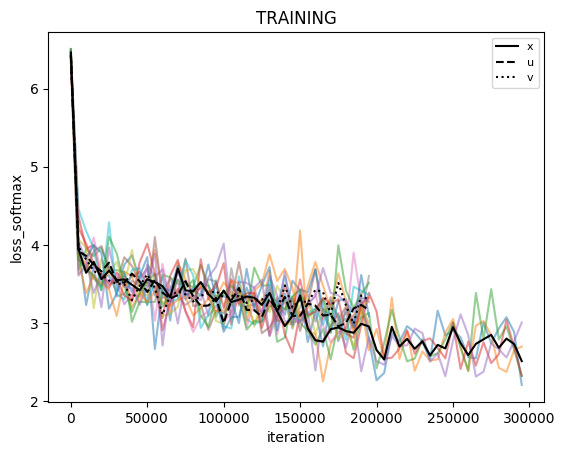
Given that the loss function and other parameters for the validation samples seem to reach a minimum far sooner than iteration 300k (see fig below), i tried these 2 things:
model "u":
learning rate = 0.0001 to iteration 80000
learning rate = 0.00001 from iteration 80000 to 200000
models are saved at iterations 100k, 130k, 160k, and 200k
model "v":
learning rate = 0.0001 to iteration 50000
learning rate = 0.00001 from iteration 50000 to 200000
models are saved at iterations 100k, 130k, 160k, and 200k
Here's what's happening. There are 5 cross-validations for each model, the averages are shown in black.
M_square= <(zspec-zcnn_mean)**2.0>
bias = < (zcnn_mean-zspec)/(1+zspec) > as in our paper (the plot is incomplete because i added it to the code half way through the process).
I kept zcnn_mean (pdf weighted mean) because it's faster to compute, although the median gives better results.
INFERENCES:
The performance at 160k and 200k for "u" and "v" are quasi similar, and only slightly better than at 100k.
Here's how the models compare for the test sample that was kept aside (ZCNN is the PDF median here) :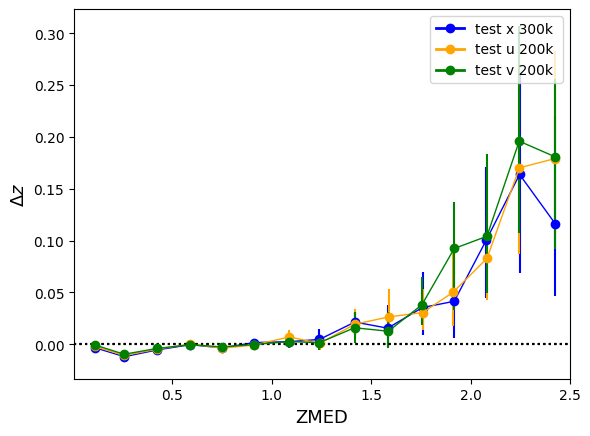
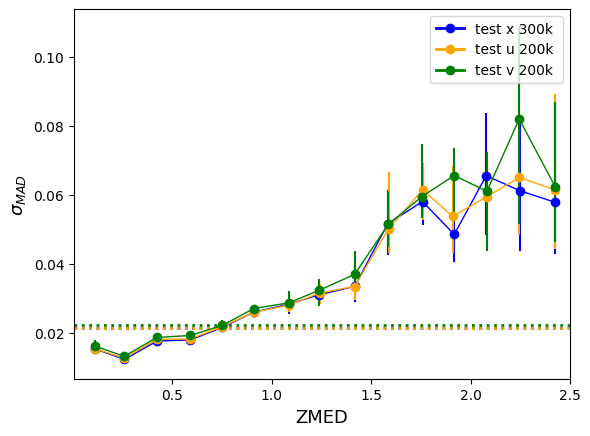
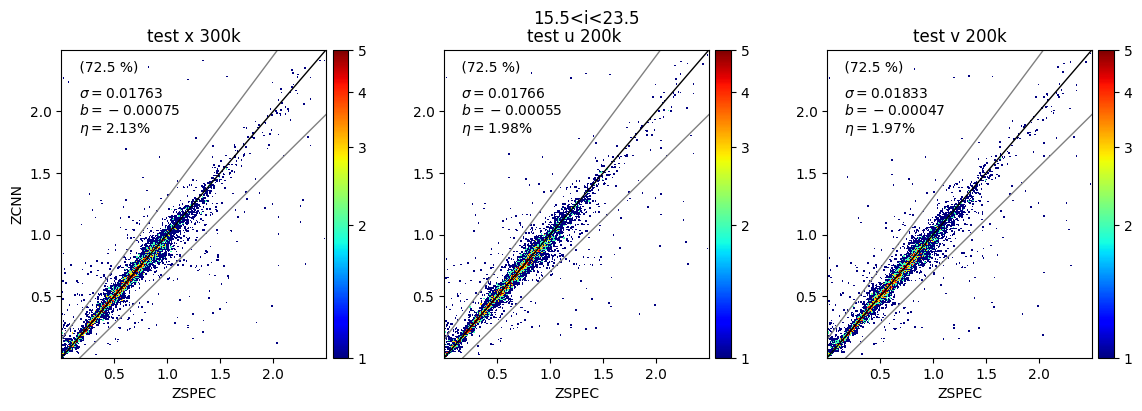
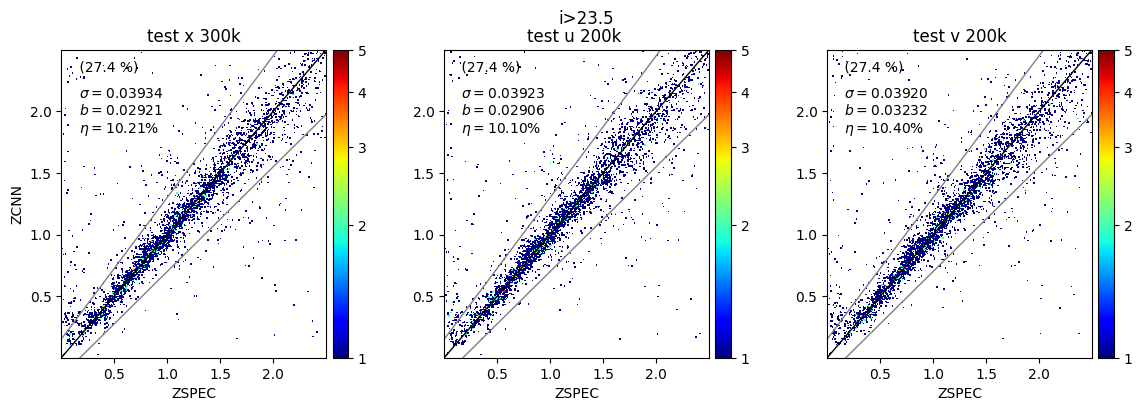
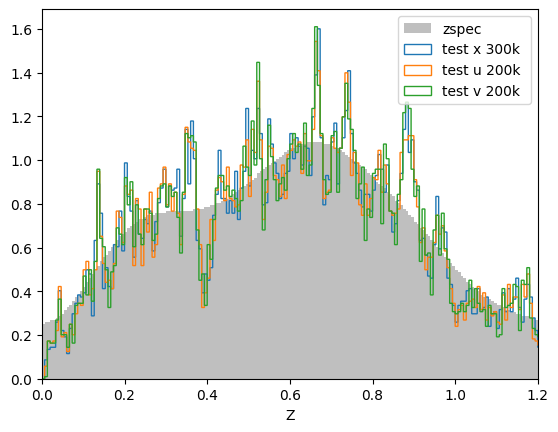
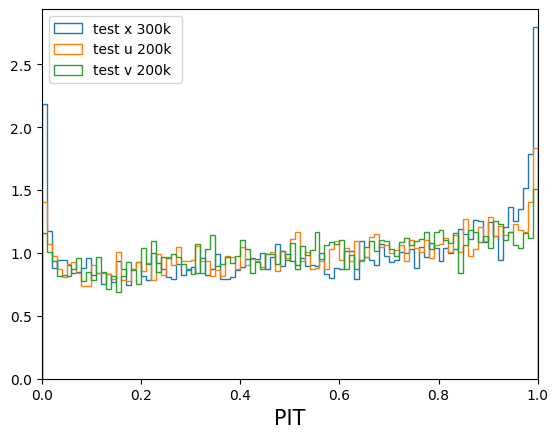
The models aren't significantly different but the "u" (and even "v") trainings run in half the time as "x" (~4h for 1 cross-validation versus ~8h). Also the PDFs are smoother. I wanted to show a random sample of PDFs as well as the distribution of local peaks (above 5%) for "x", "u" and "v" but i seem to have exceeded my quota. Can we change this? Also Jerome is not part of this group and Johanna's address will change soon, we need to do something about that too!
Files
 Updated by Stephane Arnouts over 5 years ago
The models aren't significantly different but the "u" (and even "v") trainings run in half the time as "x" (~4h for 1 cross-validation versus ~8h). Also the PDFs are smoother. I wanted to show a random sample of PDFs as well as the distribution of local peaks (above 5%) for "x", "u" and "v" but i seem to have exceeded my quota. Can we change this? Also Jerome is not part of this group and Johanna's address will change soon, we need to do something about that too!
Great ! results appear quite similar between the 3 versions. v model leads also larger PDF with a better PIT at the end. In the stats there is also a mix of DEEP and WIDE images I guess, which should also be distinguished
J'ai ajouté Jerome dans les membres du wiki !
 Updated by Stephane Arnouts over 5 years ago
It seems than the x-model from J&J miss the minimum before 150k and then degrades (in the loss and M^2) even with a smaller learning rate, in contrast to the u and v model. But the weird thing is at the end the Sigma is still better for the x-model. Is this normal ?TRAINING TESTS:
model "x" (Jo&Je settings) :
learning rate = 0.0001 to iteration 150000
learning rate = 0.00001 from iteration 150000 to 300000
the model is saved at iteration 300kGiven that the loss function and other parameters for the validation samples seem to reach a minimum far sooner than iteration 300k (see fig below), i tried these 2 things:
model "u":
learning rate = 0.0001 to iteration 80000
learning rate = 0.00001 from iteration 80000 to 200000
models are saved at iterations 100k, 130k, 160k, and 200kmodel "v":
learning rate = 0.0001 to iteration 50000
learning rate = 0.00001 from iteration 50000 to 200000
models are saved at iterations 100k, 130k, 160k, and 200kHere's what's happening. There are 5 cross-validations for each model, the averages are shown in black.
M_square= <(zspec-zcnn_mean)**2.0>
When changing the learning rate there is a boost in the loss and sigma. can we change the learning rate one more time to see if another gain appear after 100-200k iteration ?